SharePoint is very big system and consists of so many modules integrated. We can do lot of customization and all our code will be deployed to SharePoint and end users will use it. But, what if client comes to you with the question, “why my SharePoint site is loading very slow?” How you proceed?
First thing you need to check is all server configurations like is memory is sufficient/ Processor is sufficient etc.. After you found they are more than enough, now it’s time to find problem in the code. Till SharePoint 2007, it’s very difficult to find which part of the code is taking how much time and analyze it better. But luckily in SharePoint 2010, Microsoft added a very nice feature for developers to detect which module is taking how much time. It will record all the requests and the time to get response etc…. This is what we are calling Developer Dashboard.
The great advantatge with it is, it will differ the requests and show like, database queries [Which query took how much time], SPRequest allocation, Webpart event offsets, etc in very detailed way. I really love it. Thanks a ton to SharePoint 2010 team.
The developer dashboard records and display performance statistics of the related code that executed to produce current page.
How to enable/disable it on the specific site?
Method 1: [STSADM]
‘On’ Mode :
STSADM –o setproperty –pn developer-dashboard –pv On
‘Off’ Mode:
STSADM –o setproperty –pn developer-dashboard –pv Off
‘OnDemand’ Mode:
STSADM –o setproperty –pn developer-dashboard –pv OnDemand
Suppose you’d like to only display the developer dashboard if one or more acceptable values are exceeded, there’s a way to do that too by running:
STSADM –o setproperty –pn developer-dashboard –pv expensiveoperationsonly
Once you executed the command the output is “Operation executed successfully.”
Method 2: Windows Powershell script:
You need to open the windows power shell prompt and copy the below script and hit enter.
$DevDashboardSettings = [Microsoft.SharePoint.Administration.SPWebService]::ContentService.DeveloperDashboardSettings;
$DevDashboardSettings.DisplayLevel = ‘OnDemand’;
$DevDashboardSettings.RequiredPermissions = ‘EmptyMask’;
$DevDashboardSettings.TraceEnabled = $true;
$DevDashboardsettings.Update();
The both above methods will enable developer dashboard to entire farm level.
UPDATED**
“DevDashboardSettings.RequiredPermissions determines which users will see the developer dashboard. EmptyMask means all users will be able to access developer dashboard. Any mask available in SPBasePermissions object can be used to filter down to a specific group so that only a small subset of users will be able to access developer dashboard.”
Now, when you browse to the web site you can’t find it immediately on the screen. You need explicitly enable for the page. Find a small image at the corner of the page as shown below.
That image behaves as a toggle button. When you click very first time then the developer dashboard will be enabled for the specific page. When you click again, then it will go off. You can’t see that until you click it again.
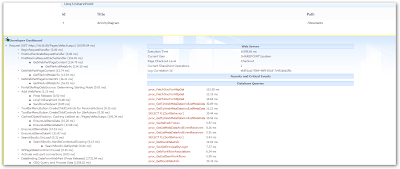
How it looks like:
Note: This option is page specific level. So, when you enable it and move to another page it’s default state is closed/disabled.

